TORBAL ® Rx brings you pillcounting.com - experience our tablet counters, learn about our technology, understand the features...
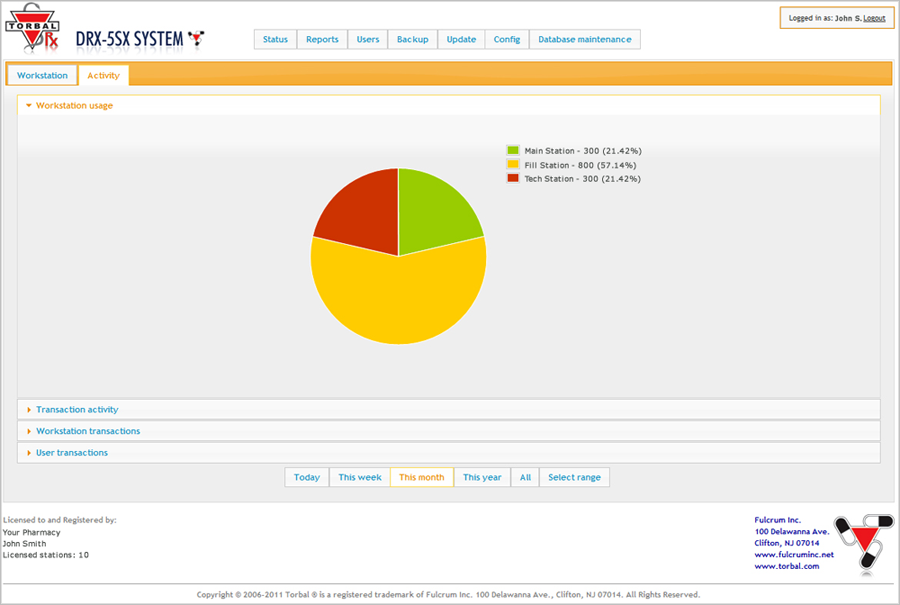
Details of performed counting transactions are instantly recorded by the TORBAL Server. Transactions are compiled into graphs and charts for easy and fast interpretation. General system activity is displayed in a pie chart called the "Workstation usage". The chart shows how many prescriptions have been counted on a particular workstation, allowing the administrator to make sure that prescriptions are evenly spread out among all workstation in the system. The "Transaction activity" line graph shows the number of transactions performed in a specified time frame. This graph is often used to interpret prescription counting and processing patters. Other graphs show information pertaining to pill counting transaction made by specific users and workstations.